Schools in Highland County saw no new student or staff COVID-219 cases, according to an Ohio Department of Health (ODH) system that documents how each school in the county is fairing with the virus. New cases are reported by the most recent week which is defined as “the previous Monday through Sunday.”
According to ODH COVID-19 Dashboard on Monday, since the pandemic began, Highland County has had 3,450 total COVID-19 cases, 183 hospitalizations, 58 deaths and 3,318 presumed recovered from the virus.
In other news, the gap in vaccination numbers for Ohio and Highland County continues to widen.
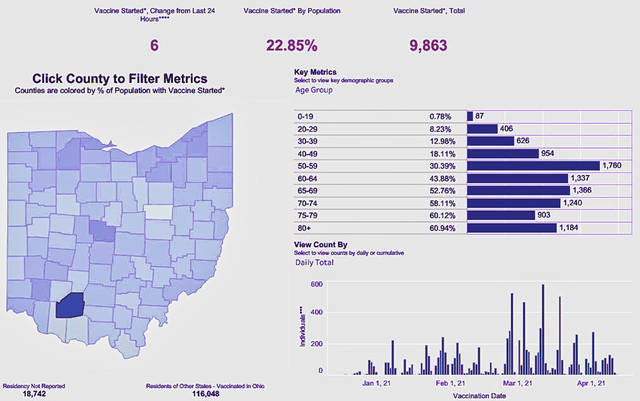
The state average for those who have started the vaccine percent is 35.27 percent, significantly more than the Highland County percentage of 22.85 percent of the county’s population.
In terms of completed vaccines, the state average is 22.62 percent, whereas the Highland County average is 17.15 percent.
A breakdown of the percentages for Highland County and Ohio are listed below.
According to the dashboard on Monday, 22.85 percent of the population in Highland County has started its vaccinations, equaling 9,863 people. The ODH considers started as “when an individual has received at least one valid dose of COVID-19 vaccine.”
The dashboard lists the following COVID-19 figures for various age groups in Highland County:
* 0-19 — 87 people, or 0.78 percent, have started their vaccines.
* 20-29 — 406 people, or 8.23 percent, have started their vaccines.
* 30-39 — 626 people, or 12.98 percent, have started their vaccines.
* 40-49 — 954 people, or 18.11 percent, have started their vaccines.
* 50-59 — 1,760 people, or 30.39 percent, have started their vaccines.
* 60-64 — 1,337 people, or 43.88 percent, have started their vaccines.
* 65-69 — 1,366 people, or 52.76 percent, have started their vaccines.
* 70-74 — 1,240 people, or 58.11 percent, have started their vaccines.
* 75-79 — 903 people, or 60.12 percent, have started their vaccines.
* 80 and over — 1,184 people, or 60.94 percent, have started their vaccines.
According to the dashboard, 17.15 percent of the population in Highland County has completed its vaccinations, equaling 7,401 people. The ODH considers completed when “an individual has received all recommended COVID-19 vaccine doses and is considered fully immunized.”
The dashboard lists the following COVID-19 figures for various age groups in Highland County:
* 0-19 — 23 people, or 0.21 percent, have completed their vaccines.
* 20-29 — 217 people, or 4.40 percent, have completed their vaccines.
* 30-39 — 362 people, or 7.51 percent, have completed their vaccines.
* 40-49 — 538 people, or 10.21 percent, have completed their vaccines.
* 50-59 — 1,038 people, or 18.70 percent, have completed their vaccines.
* 60-64 — 1,011 people, or 33.18 percent, have completed their vaccines.
* 65-69 — 1,137 people, or 43.92 percent, have completed their vaccines.
* 70-74 — 1,108 people, or 51.92 percent, have completed their vaccines.
* 75-79 — 824 people, or 54.86 percent, have completed their vaccines.
* 80 and over — 1,098 people, or 56.51 percent, have completed their vaccines.
According to the dashboard on Monday, 35.27 percent of the Ohio population has started its vaccinations, equaling 4,122,416 people.
The dashboard lists the following COVID-19 figures for various age groups in Ohio:
* 0-19 — 96,790 people, or 3.35 percent, have started their vaccines.
* 20-29 — 354,487 people, or 22.82 percent, have started their vaccines.
* 30-39 — 447,833 people, or 30.32 percent, have started their vaccines.
* 40-49 — 524,857 people, or 37.84 percent, have started their vaccines.
* 50-59 — 726,314 people, or 47.10 percent, have started their vaccines.
* 60-64 — 473,199 people, or 59.41 percent, have started their vaccines.
* 65-69 — 469,872 people, or 70.46 percent, have started their vaccines.
* 70-74 — 398,232 people, or 76.23 percent, have started their vaccines.
* 75-79 — 264,711 people, or 74.03 percent, have started their vaccines.
* 80 and over — 366,121 people, or 73.30 percent, have started their vaccines.
According to the dashboard, 22.62 percent of the population in Ohio has completed its vaccinations, equaling 2,644,249 people.
The dashboard lists the following COVID-19 figures for various age groups in Ohio:
* 0-19 — 17,416 people, or 0.60 percent, have completed their vaccines.
* 20-29 — 151,248 people, or 9.74 percent, have completed their vaccines.
* 30-39 — 210,122 people, or 14.23 percent, have completed their vaccines.
* 40-49 — 240,314 people, or 17.32 percent, have completed their vaccines.
* 50-59 — 398,176 people, or 25.82 percent, have completed their vaccines.
* 60-64 — 332,010 people, or 41.69 percent, have completed their vaccines.
* 65-69 — 385,031 people, or 57.74 percent, have completed their vaccines.
* 70-74 — 343,592 people, or 65.77 percent, have completed their vaccines.
* 75-79 — 234,395 people, or 65.55 percent, have completed their vaccines.
* 80 and over — 331,945 people, or 66.46 percent, have completed their vaccines.
Reach Jacob Clary at 937-402-2570.


